Diagnostics
The BSB is instrumented with OpenTelemetry for observability and diagnostics purposes. This guide explains how to set up tracing and profiling for development and debugging.
The basic functionality of OpenTelemetry is to collect traces, events, and metrics.
Traces: Represent the execution path of a request through the system, capturing function calls, spans, and durations.
Events: Time-stamped annotations or logs attached to spans, providing contextual information about specific points in execution.
Metrics: Aggregated measurements such as counters, gauges, and histograms to monitor system performance over time.
We want to make sure that we export these entities to a collector, so that we can view the recorded data later on the collector. This means we need to configure OpenTelemetry on 2 sides:
Exporter: Configured in the Python process, it sends collected traces, events, and metrics to the collector. This typically involves setting the exporter type (OTLP, Jaeger, Prometheus, etc.), endpoint, and security options.
Collector: A separate service, such as Jaeger running in Docker, which receives, aggregates, and stores the telemetry data. The collector can then forward the data to UI dashboards for inspection and analysis.
This dual configuration ensures that instrumentation in code generates telemetry while the collector provides a centralized view for diagnostics and performance monitoring.
Jaeger Setup
To collect and visualize traces, you can use Jaeger. The easiest way to set up Jaeger is using Docker:
docker run -d \
    --name jaeger \
    -p 9411:9411 \
    -p 4318:4318 \
    -p 4317:4317 \
    -p 16686:16686 \
    -p 5778:5778 \
    cr.jaegertracing.io/jaegertracing/jaeger:2.9.0
Visit http://localhost:16686 and have a look around. Since no one is sending any OpenTelemetry data to Jaeger yet, there won’t be much to see yet.
OpenTelemetry Instrumentation
The BSB supports OpenTelemetry instrumentation through the opentelemetry-instrument command-line tool, which provides zero-code instrumentation capabilities. For detailed configuration options, refer to the OpenTelemetry Python Documentation.
The following command demonstrates how to enable tracing and metrics, and to send the data to your Jaeger docker:
opentelemetry-instrument \
    --traces_exporter otlp \
    --exporter_otlp_endpoint http://localhost:4317 \
    --service_name "BSB Workflow" \
    python -m bsb compile --clear
Command options explained:
- --traces_exporter otlp: Send data via OTLP protocol
- --exporter_otlp_endpoint http://localhost:4317: Specifies the OTLP endpoint, to send the data to your Jaeger docker.
- Additional options can be found in the OpenTelemetry Python documentation
The instrumentation will: - Export traces to both console and OTLP endpoint for analysis - Send OTLP data to the configured Jaeger instance (or other compatible backends) - Automatically instrument the BSB compilation process with minimal overhead
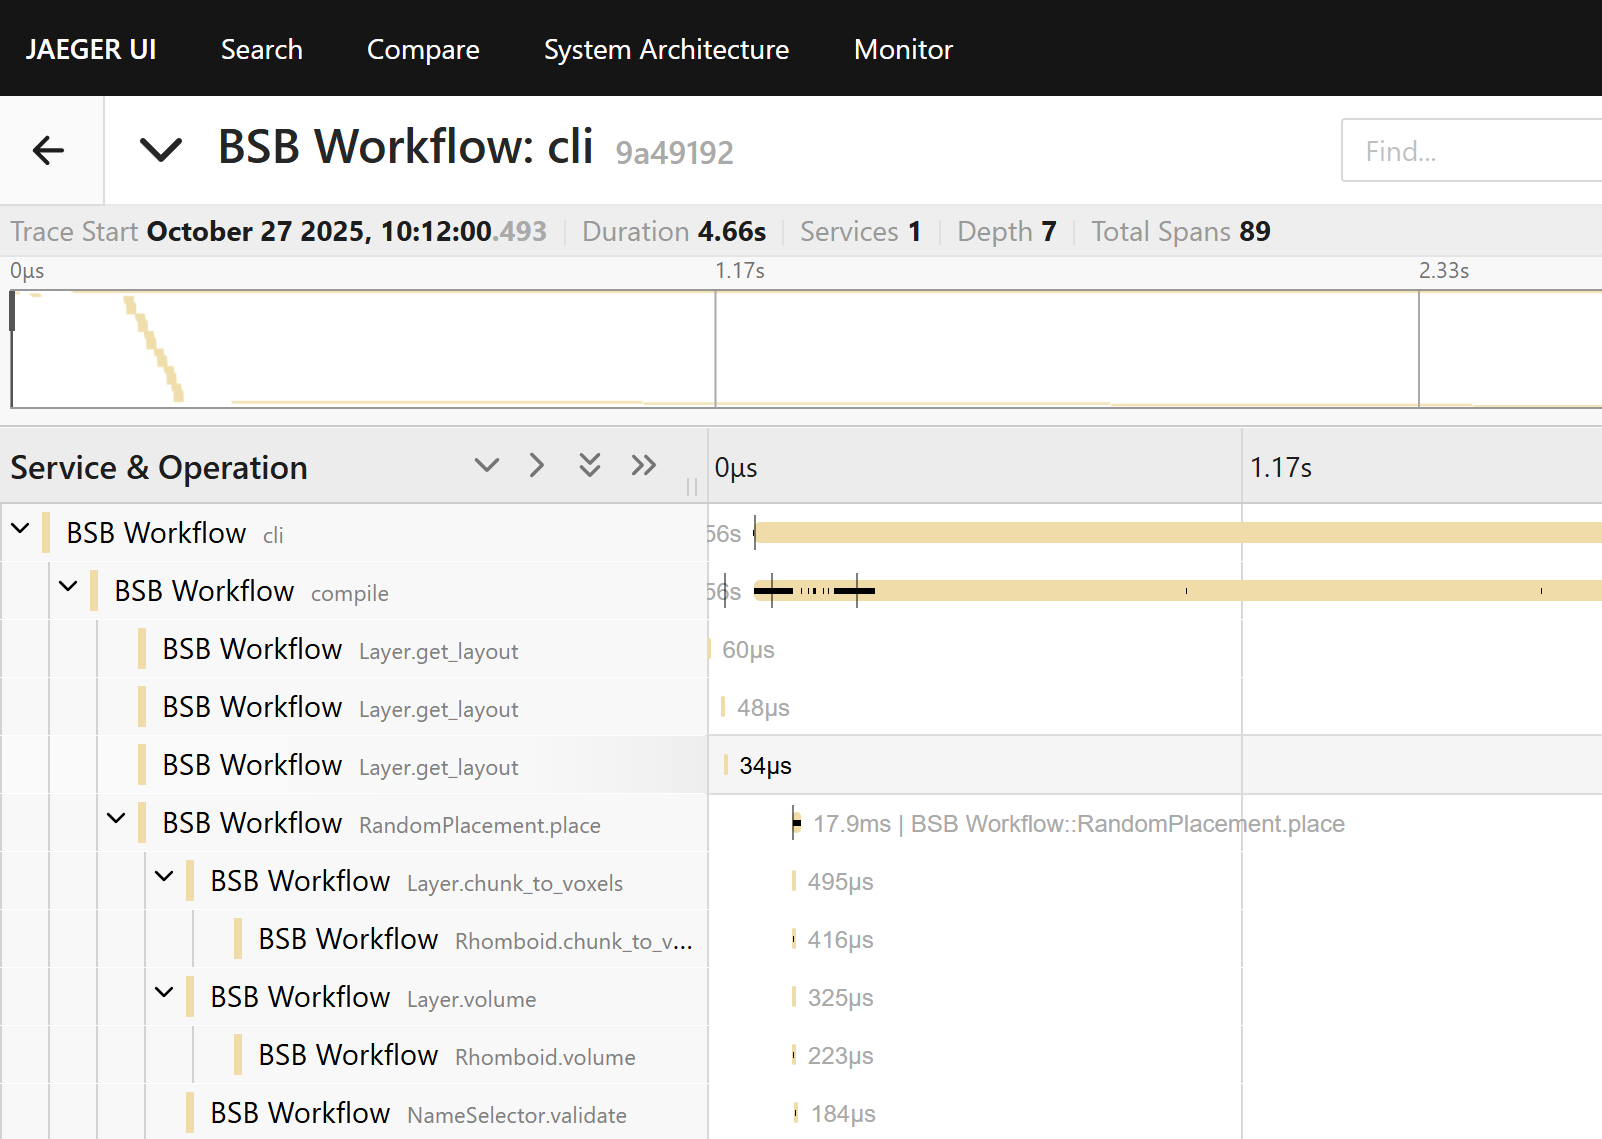
Once the bsb command has completed, on your Jaeger instance, you should see “BSB Workflow” appear under the Service dropdown. Click Find Traces. Select a trace from the timeline, and you should see a timeline graph of the process.
Important
While your BSB process is running, the “BSB Workflow” will start
appearing on your Jaeger interface; but remember that only the traces
from completed functions are sent to Jaeger. In the above example, you
will not see the cli and compile function until the reconstruction
has been completed.
Collecting telemetry data on HPC
Sometimes you are running processes on a remote machine (e.g., an HPC node) where you cannot run or view the Jaeger UI locally. In such cases, you can configure OpenTelemetry to send traces and metrics from the remote machine to a collector running on your own local machine. Using a tunneling service like ngrok allows the remote processes to connect to your local collector over the network.
Step-by-step guide
Install ngrok
Follow the official ngrok installation guide for your platform on your local machine (not the HPC). Start a working agent and obtain a public endpoint address (e.g., 0.tcp.ngrok.io:12345) for the port your local OpenTelemetry collector is listening on.
When starting ngrok, forward the OTLP gRPC port (4317) from your local machine:
ngrok tcp 4317
This will display the public endpoint that remote HPC processes should use as their OTLP endpoint.
Start your OpenTelemetry collector locally
Make sure your collector (e.g., Jaeger on port 4317) is running:
docker start jaeger
Run remote HPC processes with full OpenTelemetry CLI configuration
On the HPC nodes, specify the OTLP endpoint and disable TLS directly in the opentelemetry-instrument command:
opentelemetry-instrument \
    --traces_exporter otlp \
    --exporter_otlp_endpoint http://0.tcp.eu.ngrok.io:12345 \
    --service_name "BSB Workflow" \
    python -m bsb compile --clear
Verify traces
On your local machine, open the Jaeger UI:
http://localhost:16686
Traces will appear after the BSB workflow has concluded.
Notes
Ensure the firewall on your local machine allows outbound ngrok connections and that the remote HPC nodes can reach the ngrok TCP endpoint.
Ensure you are forwarding the TCP port, and using a http:// prefix in the OTLP endpoint URI.
Ngrok free accounts may have dynamic addresses; update the remote OTLP endpoint in the command if it changes.
Collecting telemetry data with MPI/SLURM
The workflow through MPI/SLURM is the same, simply prepend the command with mpirun/srun and it works the same:
mpirun -n 4 \
  opentelemetry-instrument \
    --traces_exporter otlp \
    --exporter_otlp_endpoint http://0.tcp.eu.ngrok.io:12345 \
    --service_name "BSB Workflow" \
    python -m bsb compile --clear
Important
Remember that only completed BSB functions will appear on the collector interface, which might make it difficult to read the traces while the BSB process is running, especially in multicore. Once the process is completed though, you should see the traces of each core cleanly separated.
Please note this only works for CLI commands (or python -m bsb). If you’re using the BSB via Python with MPI, you might notice that all the MPI ranks are reporting to different traces. To fix this, wrap all BSB code as such:
from bsb.profiling import _telemetry_trace

with _telemetry_trace("My Script", broadcast=True):
    # Your BSB code here
Now you should see all of the BSB telemetry reported in a single trace again.
API
OpenTelemetry spans can be added using _telemetry_trace().
Profiling
The BSB includes a profiling module that can be enabled through various methods:
Command line flag:
python -m bsb compile --profiling
Environment variable:
export BSB_PROFILING=1
python -m bsb compile
Configuration option in code:
from bsb import options
options.profiling = True
The profiling results will be collected and can be analyzed to identify performance bottlenecks and optimization opportunities.